Human Chitinase 3-like 1 ELISA Performance data
Introduction
Human Chitinase 3-like 1 (CHI3L1) is a protein that belongs to the chitinase protein family. It is also known by other names such as YKL-40 and HC-gp39. CHI3L1 is expressed in various tissues, including those related to the immune system, and its levels can be influenced by inflammatory processes.
Research suggests that CHI3L1 may play a role in various physiological and pathological conditions, including inflammation, tissue remodeling, and cancer. Elevated levels of CHI3L1 have been observed in conditions such as asthma, rheumatoid arthritis, and certain types of cancer. It is often considered a biomarker associated with inflammation and tissue damage.
Chitinase 3-like 1 (CHI3L1) has been studied for its clinical significance as a diagnostic biomarker in various diseases. Here are some examples of its relevance in different medical conditions:
Cancer: Elevated levels of CHI3L1 have been associated with certain types of cancer, including breast cancer, lung cancer, colorectal cancer, and ovarian cancer. In these cases, CHI3L1 may serve as a potential biomarker for cancer detection and prognosis. High levels of CHI3L1 are often correlated with more aggressive forms of cancer and poorer patient outcomes.
Inflammatory Diseases: CHI3L1 is often upregulated during inflammatory processes. Conditions such as rheumatoid arthritis, asthma, and inflammatory bowel disease may show increased levels of CHI3L1. Monitoring CHI3L1 levels in these diseases can provide insights into the severity of inflammation and may be useful in diagnosing and managing these conditions.
Elevated serum CHI3L1 levels have also been observed in some conditions characterized by inflammation and tissue remodeling, such as arthritis, severe bacterial infection, inflammatory bowel disease, and liver cirrhosis. In asthma, serum CHI3L1 levels have been reported to correlate positively with the severity of the disease and adversely with lung function
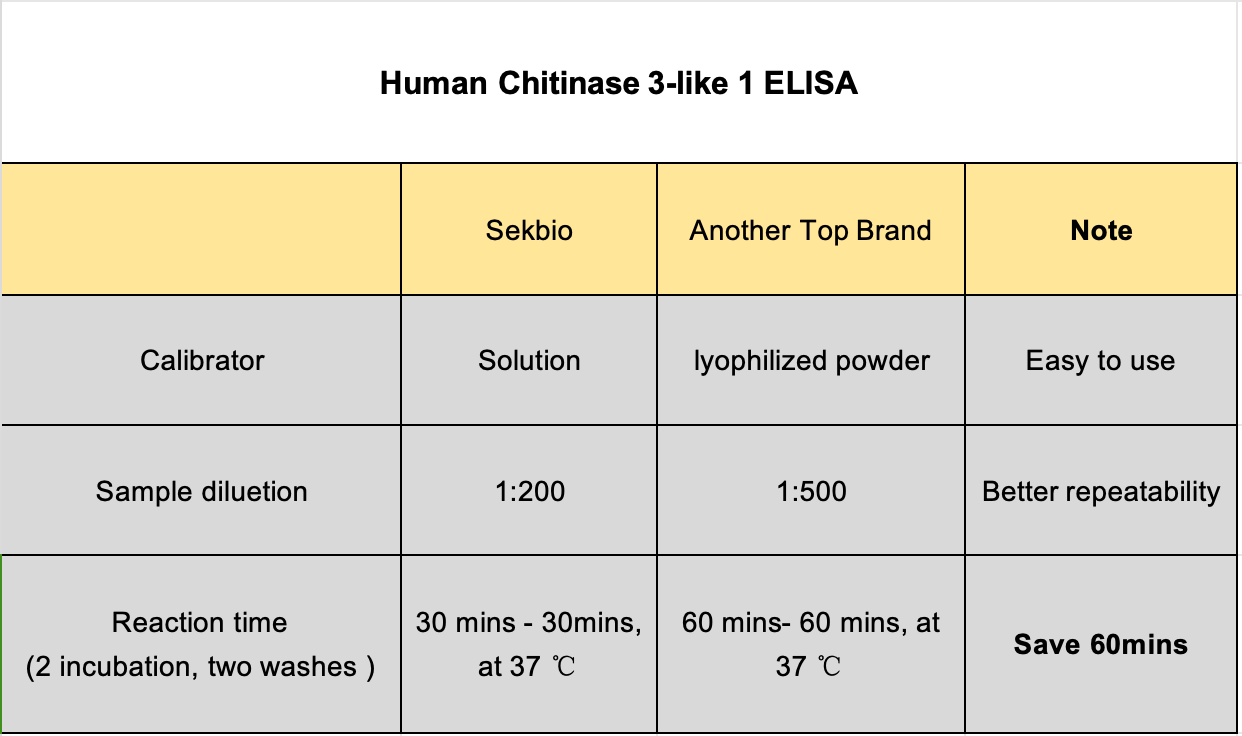
Its ELISA protocol
Step 1: Add 100 μl diluted sample per well, and incubate at 37°C for 30 minutes.
Step 2: Wash three times with washing solution, 300 μl per well
Step 3: Incubate with antibody-HRP 100 μl per well, at 37°C for 30 minutes.
Step 4: Wash three times with washing solution, 300 μl per well
Step 5: Mix the chromogenic solution A/B in a 1:1 ratio, add 100 μl per well, incubate at 37°C for 15 minutes, and add 50 μl per well of stop solution.
Step 6: Measure at an OD450 wavelength.
Calibration Curve | ||||
Calibrator | ng/ml | OD | OD | AVE |
Cal 1 | 0 | 0.014 | 0.01 | 0.012 |
Cal 2 | 37.5 | 0.327 | 0.318 | 0.323 |
Cal 3 | 75 | 0.609 | 0.588 | 0.599 |
Cal 4 | 150 | 1.057 | 1.029 | 1.043 |
Cal 5 | 300 | 1.746 | 1.627 | 1.687 |
Cal 6 | 600 | 2.406 | 2.373 | 2.390 |
Performance Data
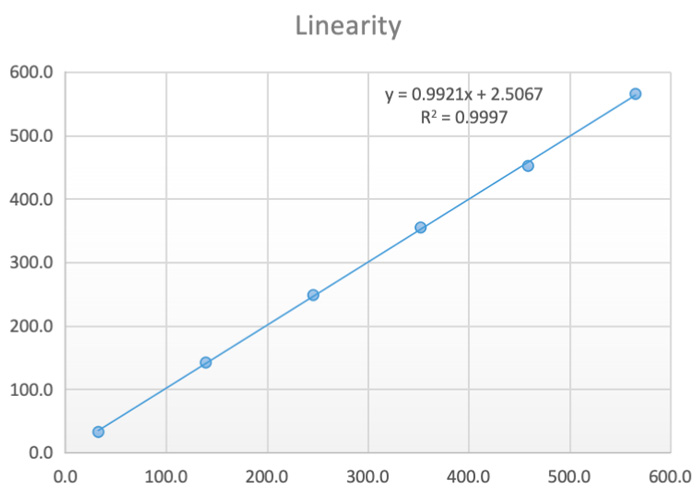
1. Linearity data
Linearity | OD | OD | OD | OD AVE | CV |
Cal. 1 | 0.283 | 0.272 | 0.297 | 0.284 | 4.4% |
Cal. 2 | 0.976 | 1.001 | 1.045 | 1.007 | 3.5% |
Cal. 3 | 1.489 | 1.483 | 1.517 | 1.496 | 1.2% |
Cal. 4 | 1.806 | 1.842 | 1.91 | 1.853 | 2.9% |
Cal. 5 | 2.097 | 2.125 | 2.087 | 2.103 | 0.9% |
Cal. 6 | 2.341 | 2.32 | 2.335 | 2.332 | 0.5% |
Theoretical Conc. | Conc. ng/ml | Conc. ng/ml | Conc. ng/ml | AVE ng/ml | CV |
32.8 | 32.7 | 31.3 | 34.4 | 32.8 | 4.8% |
139.4 | 136.4 | 141.0 | 149.1 | 142.2 | 4.5% |
245.9 | 246.6 | 245.1 | 253.8 | 248.5 | 1.9% |
352.5 | 338.9 | 351.0 | 375.0 | 355.0 | 5.2% |
459.0 | 449.4 | 461.8 | 445.1 | 452.1 | 1.9% |
565.6 | 570.6 | 558.9 | 567.3 | 565.6 | 1.1% |
2. Repeatability data
Control | OD | OD | AVE | CV | Conc. ng/ml | Conc. ng/ml | AVE | CV |
R1 | 0.582 | 0.624 | 0.597 | 6.1% | 72.9 | 79.0 | 75.141 | 7.1% |
0.563 | 0.596 | 70.1 | 74.9 | |||||
0.57 | 0.626 | 71.1 | 79.3 | |||||
0.573 | 0.678 | 71.6 | 87.1 | |||||
0.565 | 0.597 | 70.4 | 75.0 | |||||
R2 | 1.726 | 1.727 | 1.669 | 4.0% | 313.3 | 313.6 | 296.372 | 6.8% |
1.613 | 1.653 | 279.9 | 291.4 | |||||
1.643 | 1.593 | 288.5 | 274.3 | |||||
1.668 | 1.807 | 295.8 | 339.2 | |||||
1.6 | 1.664 | 276.3 | 291.5 |
3. Method Comparison
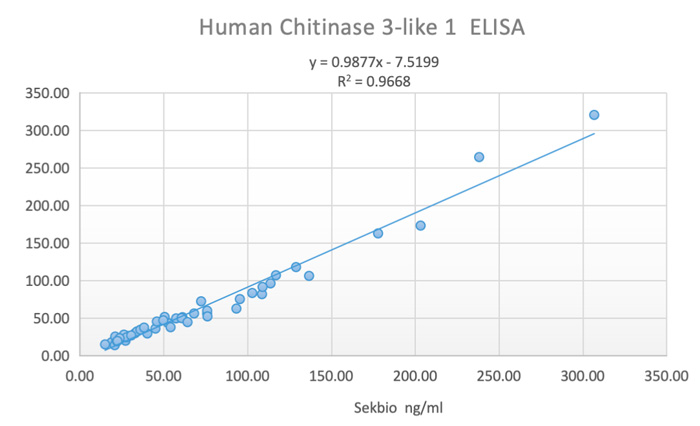
Data
Bench Mark | Sekbio | Bench Mark | Sekbio | ||||||
Clinic Sample | OD value | Conc. ng/ml | OD value | Conc. ng/ml | Clinic Sample | OD value | Conc. ng/ml | OD value | Conc. ng/ml |
S1 | 0.111 | 18.86 | 0.195 | 17.85 | S24 | 0.285 | 57.39 | 0.502 | 49.73 |
S2 | 0.121 | 21.60 | 0.204 | 18.86 | S25 | 0.496 | 95.42 | 0.757 | 75.38 |
S3 | 0.167 | 32.93 | 0.308 | 30.04 | S26 | 0.539 | 102.81 | 0.836 | 83.49 |
S4 | 0.119 | 21.07 | 0.265 | 25.51 | S27 | 0.622 | 116.94 | 1.059 | 107.14 |
S5 | 0.260 | 52.53 | 0.441 | 43.61 | S28 | 0.385 | 75.92 | 0.604 | 59.94 |
S6 | 0.147 | 28.21 | 0.274 | 26.47 | S29 | 0.191 | 38.29 | 0.380 | 37.44 |
S7 | 0.139 | 26.25 | 0.289 | 28.05 | S30 | 0.268 | 54.10 | 0.385 | 37.95 |
S8 | 0.223 | 45.07 | 0.367 | 36.11 | S31 | 1.124 | 203.25 | 1.609 | 173.18 |
S9 | 0.573 | 108.62 | 0.821 | 81.94 | S32 | 0.250 | 50.54 | 0.521 | 51.63 |
S10 | 0.200 | 40.23 | 0.304 | 29.62 | S33 | 0.305 | 61.20 | 0.518 | 51.33 |
S11 | 0.143 | 27.24 | 0.214 | 19.97 | S34 | 1.655 | 306.80 | 2.477 | 320.44 |
S12 | 0.118 | 20.80 | 0.162 | 14.03 | S35 | 0.302 | 60.64 | 0.505 | 50.03 |
S13 | 0.146 | 27.97 | 0.256 | 24.55 | S36 | 0.386 | 76.10 | 0.528 | 52.33 |
S14 | 0.227 | 45.89 | 0.460 | 45.52 | S37 | 0.321 | 64.21 | 0.452 | 44.71 |
S15 | 0.098 | 15.02 | 0.171 | 15.09 | S38 | 0.342 | 68.10 | 0.567 | 56.23 |
S16 | 0.172 | 34.07 | 0.330 | 32.32 | S39 | 0.575 | 108.96 | 0.913 | 91.51 |
S17 | 0.129 | 23.71 | 0.244 | 23.26 | S40 | 0.246 | 49.74 | 0.476 | 47.12 |
S18 | 0.123 | 22.14 | 0.207 | 19.20 | S41 | 0.484 | 93.35 | 0.632 | 62.75 |
S19 | 0.603 | 113.71 | 0.958 | 96.27 | S42 | 0.157 | 30.60 | 0.279 | 26.99 |
S20 | 0.181 | 36.09 | 0.352 | 34.58 | S43 | 0.365 | 72.31 | 0.728 | 72.43 |
S21 | 0.124 | 22.40 | 0.211 | 19.64 | S44 | 0.983 | 177.88 | 1.532 | 162.81 |
S22 | 0.385 | 75.92 | 0.565 | 56.03 | S45 | 0.693 | 128.94 | 1.157 | 117.99 |
S23 | 1.314 | 238.17 | 2.196 | 264.33 | S46 | 0.739 | 136.71 | 1.051 | 106.27 |


