A Protein A resin is a bacterial protein coupled to beads, and it is very good at holding onto antibodies. It is less good at holding onto itself. Over many purification cycles, small amounts of the ligand come off the column and travel into the eluate with the product.
Residual Protein A, also called leached Protein A, is ligand (whole or fragmented) that detaches from an affinity resin during loading, washing, elution or cleaning and ends up in the purified antibody pool. It counts as a process-related impurity, so biologics developers measure it and show that downstream steps clear it.
In October 2026 we ran Sekbio Protein A through a two-step chemiluminescence immunoassay (CLIA) sandwich, using it as the analyte the way a calibrator or spike-in standard would be used. The data is below, together with a list of what we have not tested yet.
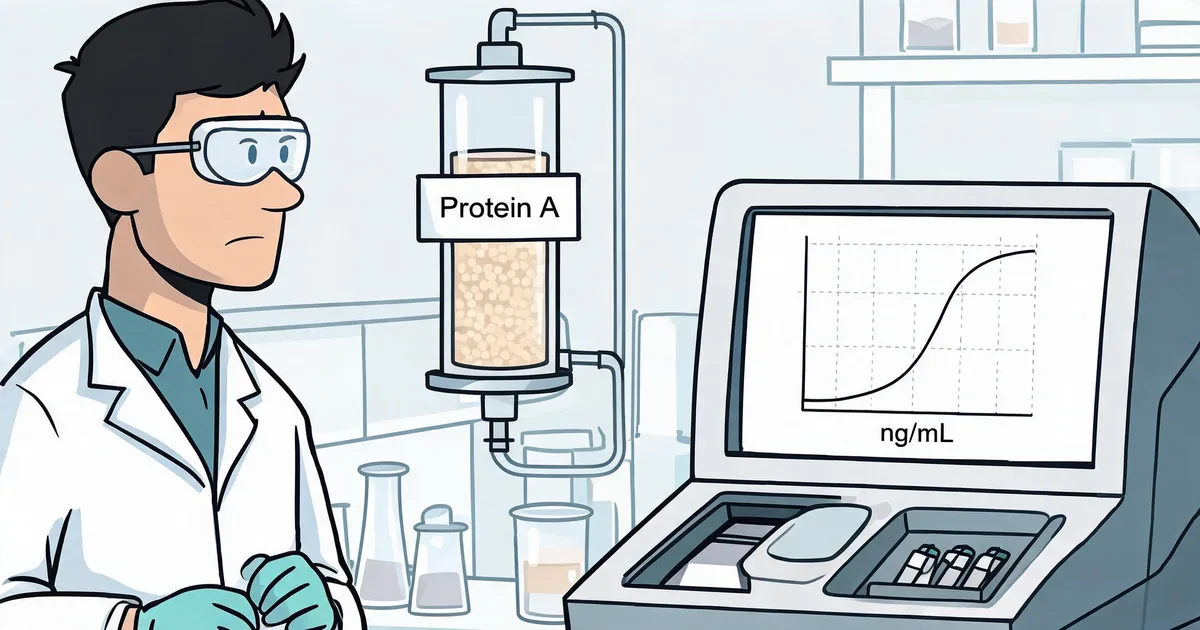
Where leached Protein A comes from
Protein A capture is the first step in most monoclonal antibody and Fc-fusion processes, and it removes the bulk of host cell proteins and DNA in one pass. The price is that the ligand itself is a protein, and it can be released. Published resin and kit guides list three recurring drivers:
- Resin ageing. Leaching tends to rise as a resin goes through more purification and cleaning cycles.
- Overloading. Running the column past its validated dynamic capacity.
- Off-window conditions. Elution or cleaning outside the validated pH, contact time or buffer range.
Leached Protein A does not always float free. It can stay complexed with product IgG, because each Protein A molecule has several immunoglobulin-binding sites. That is why commercial residual-Protein-A kits normally include a sample pretreatment step, and why any in-house method needs one too.
Why it is measured, and what limit people use
Protein A is a foreign bacterial protein, so it is controlled as an impurity in the drug substance. USP General Chapter 130 covers Protein A ligand quality for chromatography media, and notes that ELISA-type residual testing is generally used in process development and validation to confirm removal after the affinity step.
There is no universal numeric limit. Sponsors normally set one by risk assessment, taking dose, route and patient population into account. A figure that appears often in vendor material is 10 ng of Protein A per mg of antibody (example discussion). Treat it as a benchmark, not a rule.
Convert Instrument Readings to ng/mg Before Comparing Limits
A CLIA reports ng/mL of sample. Release limits are written per mg of antibody. Divide the reading by the antibody concentration in mg/mL: 0.088 ng/mL in a 1 mg/mL sample is 0.088 ng/mg. That arithmetic holds only if the matrix has been validated, which is the open item discussed below.
How the two-step CLIA sandwich is built
The format is a standard non-competitive sandwich, so light output rises with the amount of Protein A in the sample. The evaluation ran on a CLIA I2900 chemiluminescence analyzer in a 100-test reagent format.
- Sample containing Protein A is mixed with magnetic beads coated with a capture antibody, then washed.
- Acridinium ester-labeled chicken anti-Protein A antibody is added to bind the captured Protein A, then washed again.
- Trigger solutions A and B are added and the instrument reads the flash as relative light units (RLU).
The detection antibody is chicken IgY on purpose. IgY is not bound by Protein A and does not bind mammalian Fc receptors, so the labeled reagent is not captured by the analyte through its Fc region. Specifications for the reagent are on the Sekbio Chicken Anti-Protein A Antibody (IgY) page.
We use two steps, with a wash between capture and detection. Sample and reagent volumes, incubation times and bead coating are Sekbio proprietary and are not listed here.
Calibration curve: four orders of magnitude
We tested six levels in duplicate, nominally 0, 0.1, 1, 10, 100 and 1,000 ng/mL. Measured signal went from about 2.7 × 10³ RLU at the blank to 5.9 × 10⁷ RLU at the top level, a span of about 4.3 orders of magnitude.
| Assigned conc. (ng/mL) | Mean signal (RLU) | Duplicate CV | S/N vs blank |
|---|---|---|---|
| 0.0031 (blank) | 2,731 | 12.1% | 1.0 |
| 0.088 | 7,423 | 7.0% | 2.7 |
| 1.098 | 65,907 | 6.4% | 24 |
| 10.54 | 642,745 | 2.2% | 235 |
| 94.09 | 5,950,063 | 0.9% | 2,179 |
| 1,007.8 | 59,061,297 | 0.1% | 21,630 |
The four-parameter logistic fit (1/y weighted) gave R² = 0.9996, with relative residuals between −1.8% and +0.8%. From 0.088 to 1,008 ng/mL the signal climbed 8.9 to 9.9 times for every 10-fold step in concentration, close to the 10 times a slope near 1 would predict.
Duplicate CV falls as signal rises: 6.4% to 7.0% at 0.088 and 1.1 ng/mL, 2.2% at 10.5 ng/mL, and 0.1% to 0.9% at 94 ng/mL and above. The blank is the noisiest point at 12.1%, which is normal for a signal that sits at background.
Sensitivity: LoB, LoD and LoQ
Limits followed the CLSI EP17 approach. We ran 20 blank wells and 10 wells of a low sample at 0.088 ng/mL, then converted each limit from signal to concentration through the fitted curve.
| Limit | Calculation | Signal (RLU) | Concentration (ng/mL) |
|---|---|---|---|
| Limit of blank (LoB) | Blank mean + 1.645 SD | 3,033 | 0.0088 |
| Limit of detection (LoD) | LoB + 1.645 SD of low sample | 3,554 | 0.0186 |
| Limit of quantitation (LoQ) | LoB + 10 SD of low sample | 6,201 | 0.0669 |
The blank had a mean of 2,699 RLU with a 7.51% CV. All three limits sit below the lowest calibrator.
That is also the catch. Values under 0.088 ng/mL come from the curve model, not from wells we measured at those levels. We recommend 0.088 ng/mL as the reporting floor: it has a 4.32% signal CV over 10 replicates and about 100% recovery.
Repeatability and dilution linearity
Repeatability
Ten wells each at a low and a mid level:
| Level (ng/mL) | Mean signal (RLU) | Signal CV | Back-calculated conc. CV |
|---|---|---|---|
| 0.088 | 7,335 | 4.32% | 6.50% |
| 10.54 | 670,075 | 2.10% | 2.06% |
Concentration CV at the low level is higher than signal CV because that part of the curve is steep. A small change in RLU becomes a larger change in the reported number.
Dilution linearity
We mixed a low sample (0.0925 ng/mL) and a high sample (1,008 ng/mL) at 8:2, 6:4, 4:6 and 2:8, and ran six theoretical levels in triplicate.
| Theoretical (ng/mL) | Measured (ng/mL) | Recovery | Conc. CV |
|---|---|---|---|
| 0.0925 | 0.0933 | 100.9% | 9.84% |
| 201.7 | 188.0 | 93.2% | 6.88% |
| 403.3 | 385.3 | 95.6% | 4.36% |
| 604.8 | 579.9 | 95.9% | 3.15% |
| 806.4 | 800.7 | 99.3% | 1.53% |
| 1,008.0 | 1,029.1 | 102.1% | 1.12% |
Recoveries ran from 93.2% to 102.1%, all inside the 80% to 120% acceptance window. Measured against theoretical concentration, the linear fit had a slope of 1.017 (r = 0.9993) and the log-log slope was 0.997 (R² = 0.9999). The weakest level was 201.7 ng/mL at 93.2%; if you quantify in that region, check it separately.
What this data does not show yet
It was one run by one analyst on one reagent lot, and the report itself lists open items. You should know them before you plan around the numbers.
- No antibody or process-stream matrix. The samples were Protein A dilutions. We have not challenged the assay with high IgG content, pretreated eluate, or serum and plasma matrix. This is the biggest gap for residual testing.
- No lot-to-lot or day-to-day precision. The plan is three reagent lots over three days with triplicates at low, mid and high levels.
- Calibrator values come from dilution. Assigned concentrations differ from the nominal ones by up to about 12% (the 0.088 level is roughly 12% below nominal). Independent weighing checks at 1 and 100 ng/mL are still to do.
- The top of the curve is not anchored. With a highest level of 1,008 ng/mL, the fitted upper asymptote and midpoint are extrapolated. Working range is 0.088 to 1,008 ng/mL.
- Low-end limits are model-derived. More blank wells and replicates at 0.02, 0.05 and 0.09 ng/mL would confirm LoD and LoQ by measurement.
What Sekbio can send you
If you are building a residual Protein A method on a chemiluminescence platform, these are the pieces we can discuss:
- The full evaluation report, including the raw RLU tables behind every figure above.
- Sekbio Protein A material for calibrator and spike-in work.
- The paired chicken anti-Protein A antibody (IgY) used as the detection reagent.
- Feasibility runs against your matrix once you share a representative sample.
Browse the wider IVD antibody and antigen catalog, or read how we approach sandwich antibody pairing and CLIA sensitivity optimization. For purification context, see our antibody purification methods guide.
Frequently Asked Questions
What is residual Protein A and why is it measured?
Residual Protein A is ligand that detaches from a Protein A affinity resin and ends up in the purified antibody pool. It is a process-related impurity, so manufacturers quantify it in process development, validation and release testing to show that polishing steps clear it.
Is there a regulatory limit for residual Protein A?
There is no single limit that applies to every product. Many sponsors use an internal target set by risk assessment, and 10 ng of Protein A per mg of antibody is a figure vendors often cite as a benchmark. Check the limit against your regulator's guidance and your product's dose and route.
How low can a chemiluminescence assay detect Protein A?
In our October 2026 evaluation, the limit of detection was 0.0186 ng/mL and the limit of quantitation was 0.0669 ng/mL. Both were calculated from the curve below the lowest calibrator, so we recommend 0.088 ng/mL, the lowest level measured directly, as the reporting floor for now.
What concentration range did the calibration curve cover?
The curve ran from 0.088 to about 1,008 ng/mL, roughly four orders of magnitude, with a four-parameter logistic fit of R² = 0.9996. Signal rose about 9 to 10 times for every 10-fold increase in concentration. The upper end was not extended beyond 1,008 ng/mL.
Why use a chicken anti-Protein A antibody as the detection reagent?
Chicken IgY is not bound by Protein A and does not bind mammalian Fc receptors. In a Protein A assay that keeps the labeled detection antibody from being pulled out of solution by the analyte itself. See the Sekbio Chicken Anti-Protein A Antibody (IgY) page for specifications.
Has this assay been tested on antibody samples or process streams?
Not yet. The evaluation used Protein A dilution series, not samples with high IgG content. Leached Protein A can stay complexed with product antibody, so sample pretreatment and spike recovery in your own matrix still need to be verified before you rely on any CLIA method for release.
Can Sekbio provide the data and Protein A material for evaluation?
Yes. We can send the full evaluation report and discuss material for your own method development. Because matrix and instrument differ between labs, we suggest a short feasibility run on your platform first. See our immunoassay development platforms or request a quote to start the conversation.
Next Step: Run It on Your Instrument
A two-step CLIA sandwich with Sekbio Protein A gave a clean four-log calibration curve, a reporting floor of 0.088 ng/mL and 93% to 102% dilution recovery. What it has not yet done is meet a real antibody sample, and that is the test that counts for residual Protein A.
The practical move is a small feasibility run: send us a representative eluate or tell us your target limit in ng/mg, and we will plan the matrix and spike-recovery work with you. Start from our products page or contact the team.